Statistical Programming Pipeline
The clinical Biometrics chain, from collected CDISC SDTM through analysis-ready ADaM to the Tables, Listings, and Figures of a Clinical Study Report. Two open demos show the same pipeline from complementary angles: one built for traceability, one built for validation.
What it does
Recreates the daily work of statistical programming: standardize collected data into CDISC SDTM, derive ADaM analysis datasets, and aggregate those into the Clinical Study Report's Tables, Listings, and Figures, every count computed so the numbers reconcile and trace back to source. The two demos below cover the same SDTM to ADaM to TLF chain through two lenses that a real Biometrics function depends on: data lineage and independent validation.
Two views of the same pipeline
Traceability: SDTM to ADaM to TLF lineage
- A deterministic, seeded generator produces the collected SDTM domains (DM, EX, AE) with real CDISC variable names and controlled terminology; the demo derives the ADaM datasets (ADSL, ADAE) in the browser with the population and treatment-emergence logic shown on screen.
- The centerpiece is click-through traceability: click any value in a table and it lights up the ADaM rows that produced it, then the SDTM source records behind those, with the derivation printed. A subject picker runs it in reverse, flowing one person's source records forward into the table cells they land in.
- Standard outputs (Table 14.1.1 Demographics, Table 14.3.1 Treatment-Emergent AEs by SOC and PT, Listing 16.2.7.1), all computed from the ADaM so the safety-population and TEAE counts reconcile by construction.
- Full write-up and demo →
QC: double-programming the whole chain
- A pipeline that runs raw EDC through SDTM, ADaM, and 16 TFL tables for a fictional Phase 1 heart-failure study, producing define.xml, specs, and a coding dictionary at each stage.
- The centerpiece is independent double programming: Python builds every output, an independent R re-implementation re-derives it, and the two are compared (diffdf for datasets, cell-by-cell for tables). The QC target is always zero differences, and a negative-control mode proves the QC catches injected errors.
- A Define and data explorer browses every SDTM and ADaM dataset, toggles between the rows and the variable-level metadata, and downloads the submission-format files (CSV, XPT, define.xml, spec .xlsx).
- Full write-up and demo →
Two distinct demos under one pipeline. The traceability view is a from-scratch, single-file recreation that computes its derivations and table counts in the browser (file://-safe, no network). The QC view is a multi-page site generated from a real double-programmed pipeline, so it is best opened in a new tab. Both use synthetic, fictional data and are not for clinical or submission use.
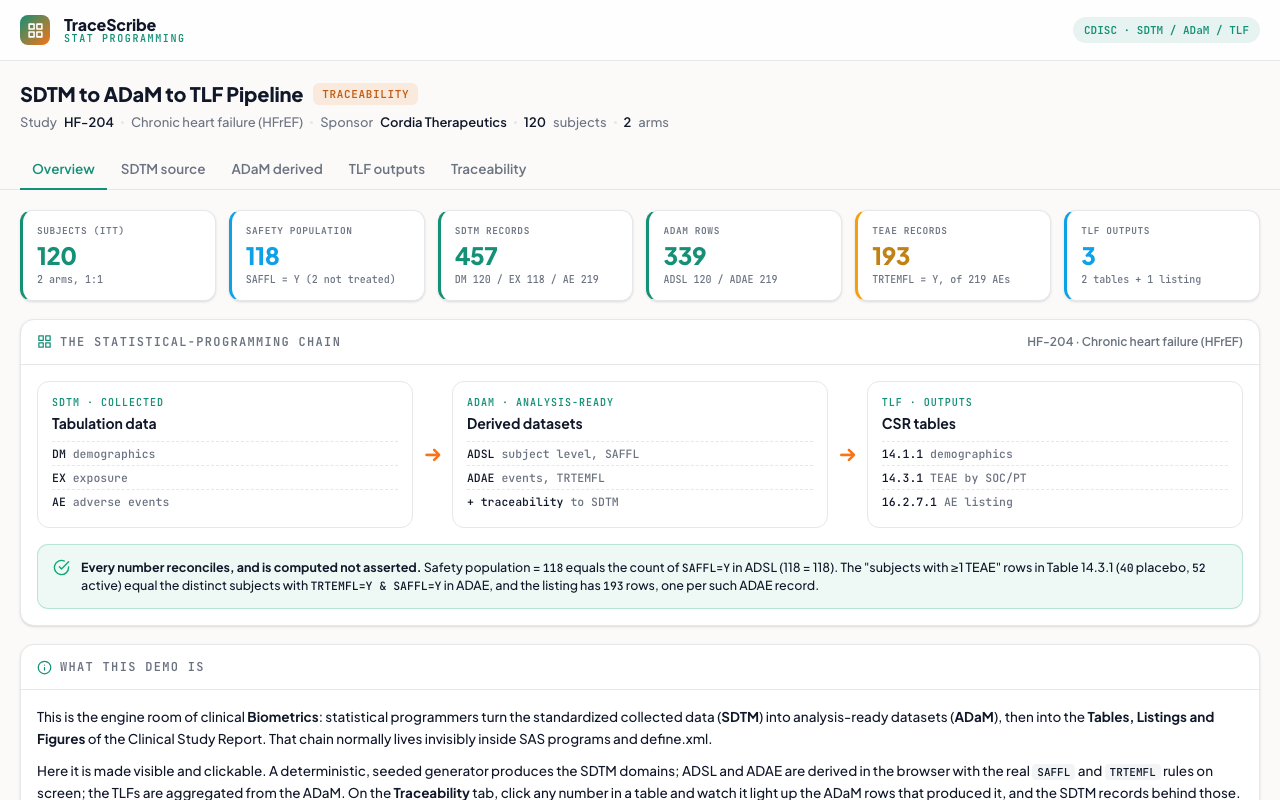 Traceability view - open the full write-up and live demo
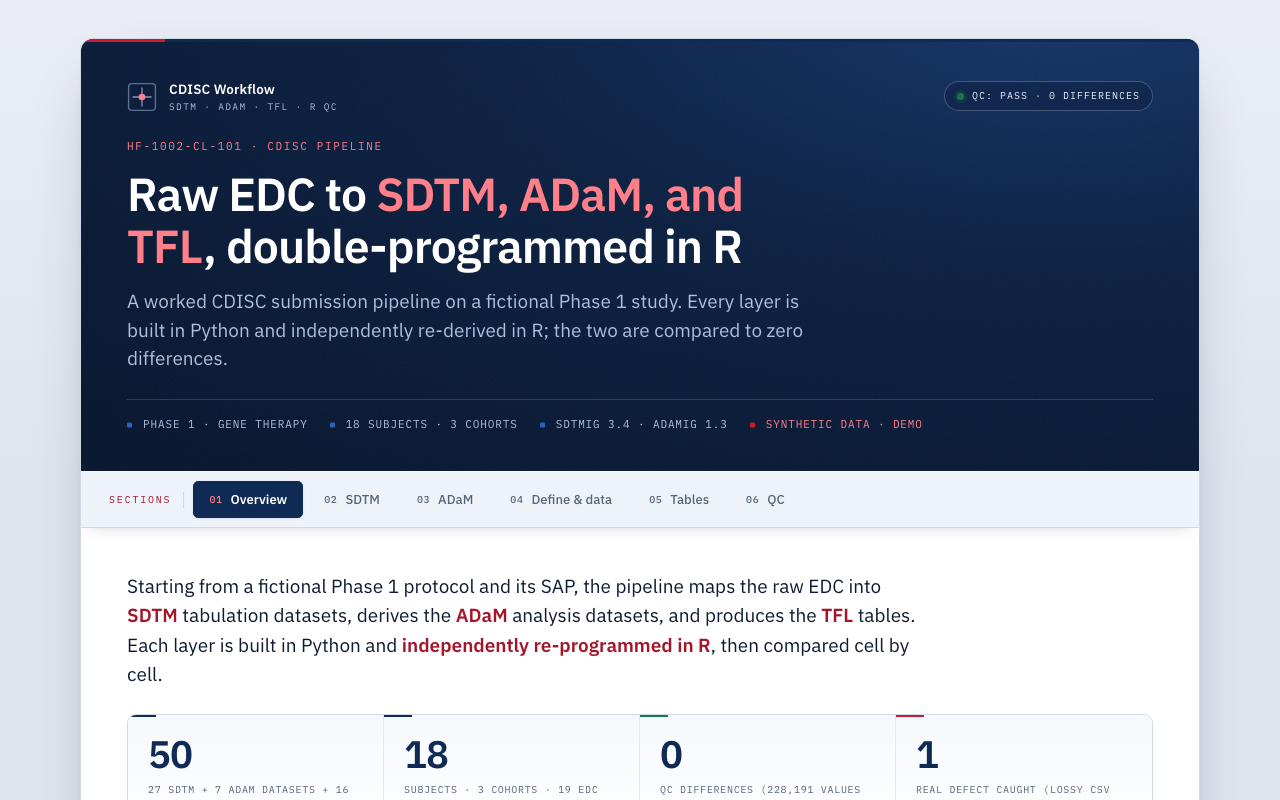 QC view - open the full write-up and live demo